Business Admin
Dashboard90-Day Cash Forecast Dashboard
Rolling cash flow tracker for freelancers managing irregular income and Net 60 gaps.
What's in the kit
- Rolling 13-week forecast dashboard: shows runway status updated every Monday
- Freelance cash flow visibility dashboard: flags GREEN, YELLOW, RED runway tiers automatically
- Net 60 payment cash gap tracker: maps invoice-to-payment delays by client terms
- Solo operator runway calculator: set your Safety Floor, see days of runway in real numbers
The situation
Why this kit exists.
If you're running a 90 day cash flow forecast freelancer setup on a spreadsheet you built yourself — or worse, in your head — you already know the problem. You invoice, you wait, you check your bank balance, and somewhere between Net 60 terms and a slow month, you find out you have 18 days of runway left. Not because you weren't paying attention. Because you had no system that was actually watching.
This kit gives you three things: a 13-week rolling cash forecast dashboard (Excel/Google Sheets), a setup guide that walks you through configuring it for your billing mix, and a one-page cheatsheet that tells you exactly what to input, what numbers to watch, and what to do when the dashboard flags a problem. That's it. No course, no video library, no community to join.
Here's how it works. Every Monday morning, before client work starts, you open the dashboard and enter five columns: client name, invoice amount, expected payment date, fixed costs for the week, and any notes. The dashboard rolls forward one week automatically, keeps a 13-week window in front of you, and flags your runway status as GREEN (90+ days), YELLOW (31–90 days), or RED (30 days or fewer). You set your own Safety Floor — the minimum cash balance below which the dashboard triggers a red alert. The default suggestion is one month of fixed costs. If you're on Net 60 terms with a major client, the dashboard shows you exactly where that 8-week cash gap lands and what your balance looks like when it hits.
This dashboard was built because the alternative — gut feel and bank balance checks — doesn't work when you're billing $5,000–$9,000 a month across a mix of retainers, project work, and clients on different payment terms. The 15-minute weekly update is the whole system. You don't need an accountant to run it. You need five columns and a Monday morning habit.
If you're thinking 'I already have a spreadsheet' — the question is whether your spreadsheet shows you a rolling 13-week window, flags runway tiers automatically, and accounts for the gap between invoice date and actual payment date by payment terms. If it does, you don't need this. If it doesn't, yours is a balance tracker, not a forecast.
Download, open the dashboard, enter your Safety Floor, and add your next three expected payments. You'll have a working forecast in under 20 minutes.
What's inside
Every file. What it does.
-

The 90-Day Cash Forecast: A Freelancer's Guide to Runway Visibility and Confident Decisions
- ◆ Excel Dashboard
The 90-Day Rolling Cash Forecast Dashboard
-
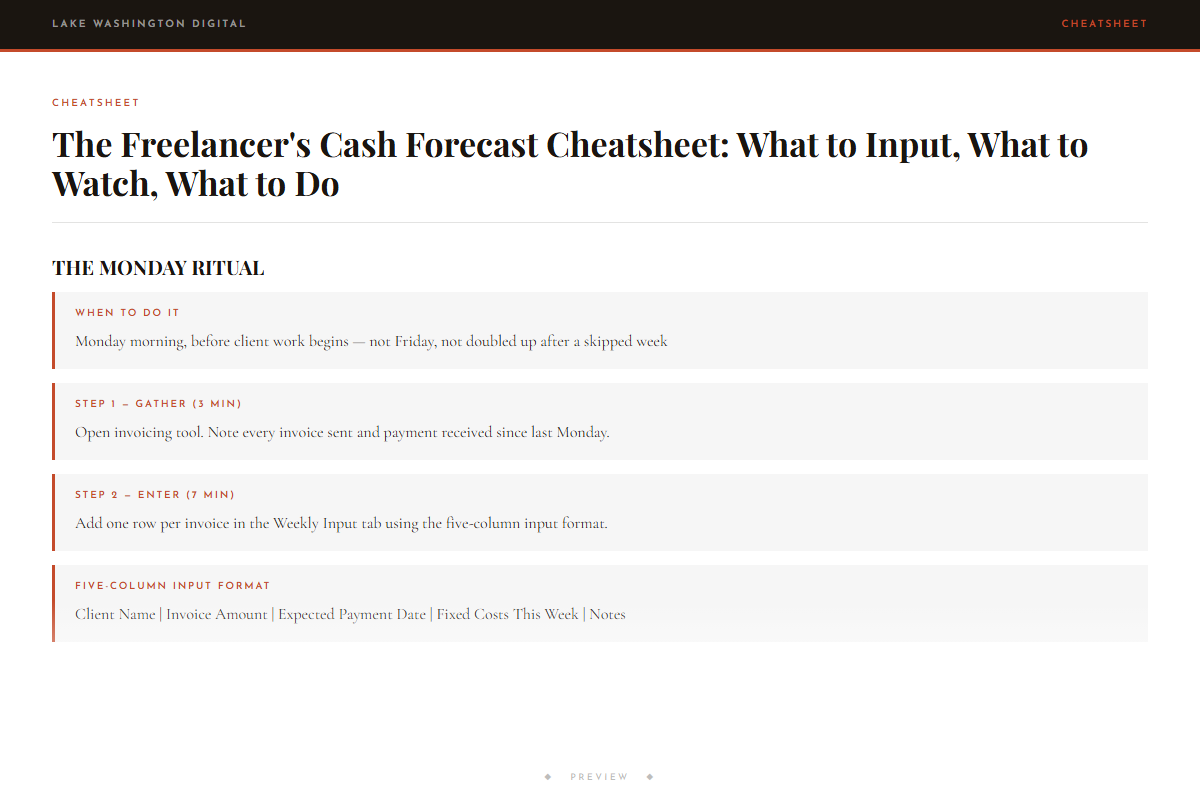
The Freelancer's Cash Forecast Cheatsheet: What to Input, What to Watch, What to Do
Who this is for
You'll get immediate use from this if…
- Freelancers billing $4,000–$11,000/month across multiple clients on different payment terms who want to see a dry pipeline coming 90 days ahead instead of 18 days too late.
- Solo operators with at least one Net 60 client who are managing the cash gap by feel and need a solo operator runway calculator that shows the gap in actual calendar weeks.
- Independent consultants or contractors considering hiring overflow help who need to answer 'can I afford to hire a contractor' with a real number, not a guess.
Questions
Before you buy.
- How do freelancers forecast cash flow without an accountant?
- This dashboard is built specifically for that situation. You enter five columns once a week — client name, invoice amount, expected payment date, fixed costs, and notes. The dashboard does the math and shows you a 13-week runway picture. No accounting background required.
- What happens when a client pays on Net 60 terms — how does the dashboard handle that?
- You enter the invoice amount and the expected payment date based on your Net 60 terms. The dashboard plots that payment in the correct week, so the 8-week gap between invoice and deposit shows up visually in your forecast. You can see exactly what your cash balance looks like during that gap.
- How many days of runway do I have left — how does the dashboard calculate that?
- The dashboard compares your projected cash balance against your Safety Floor (the minimum balance you set — default is one month of fixed costs) and flags your runway tier: GREEN means 90+ days, YELLOW means 31–90 days, RED means 30 days or fewer. The number updates every time you enter a new week.
- Can I afford to hire a contractor — is there a spreadsheet for that decision?
- The forecast dashboard shows you your projected cash balance week by week for the next 13 weeks. You can add a contractor's estimated cost as a fixed cost line item and immediately see how it affects your runway tier. That's the answer — not a formula, just your actual numbers forward-projected.
- How do I see a dry pipeline coming 90 days ahead instead of when it's already a problem?
- The rolling 13-week window is the mechanism. Because you're entering expected payment dates — not just current bank balance — the dashboard shows you weeks where no payments are scheduled. A dry pipeline shows up as a flat or declining balance line weeks before it becomes a cash crisis.
More in Business Admin
Other kits for this situation.
90-Day Cash Forecast Dashboard
Deploy the same day you download it.